Gram Analysis 1
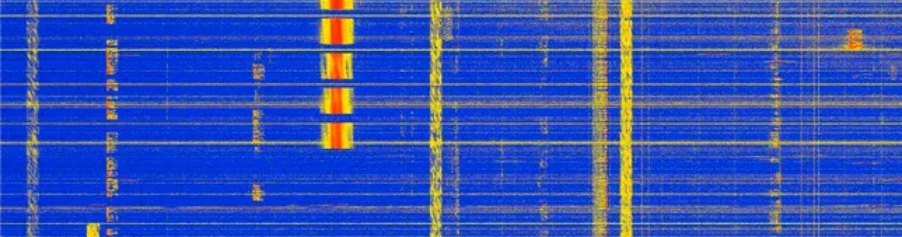
Analyze the spectrogram below and complete your analysis in the table.
Gram
 |
|
| time-start | 0 |
| time-end | 40 |
| freq-start | 100 |
| freq-end | 300 |
Analysis
Complete your analysis based on the spectrogram above:
| What is dominant source? | |
| Frequency range (Hz): | |
| Signal characteristics: | |
| Environmental factors considered: | |
| Confidence level: |
Assessment
Summarise your analysis by answering the following quetsions
| Question | Answer | Options |
|---|---|---|
| What is the maximum temperature reached | 22 | 4 |
| How many seconds was the peak level observed for? | 6 | 1 |