A diagram that has dropped its labels looks finished
The background
Explaining why a system is built the way it is usually means a slide deck, which rots quietly while the system moves underneath it. Putting the explanation inside the running system fixes that and raises something worse: the explanation is now a thing that can break, and it breaks unseen. A page that fails to load announces itself; a diagram that has quietly lost a caption does not.
The requirement
A tab carrying short illustrated explainers, one per standard the system rests on, each completable in a minute, addressable by link, readable without colour or a mouse, and reading nothing from the running system.
The options considered
Inertness is two checks rather than a rule in a document: a source scan catches an import of the transport layer but not a call arriving by a route it does not model, so a test also mounts the tab with a client whose every method throws and walks all sixty-nine steps. Each is watched failing against a fault the other misses.
Two claims were left to visual review because they looked like things only eyes can judge: that every drawing survives greyscale, and that every step is reachable by keyboard. A script walks the course headless, pressing nothing but Tab and Enter, and since it was visiting every step it measured every label against its frame. It found twenty-seven labels, across nine of the eleven explainers, drawn outside their frames and silently cut off — text set inside a drawing does not wrap. Every one of those diagrams looked finished, and several had been looked at.
The demo
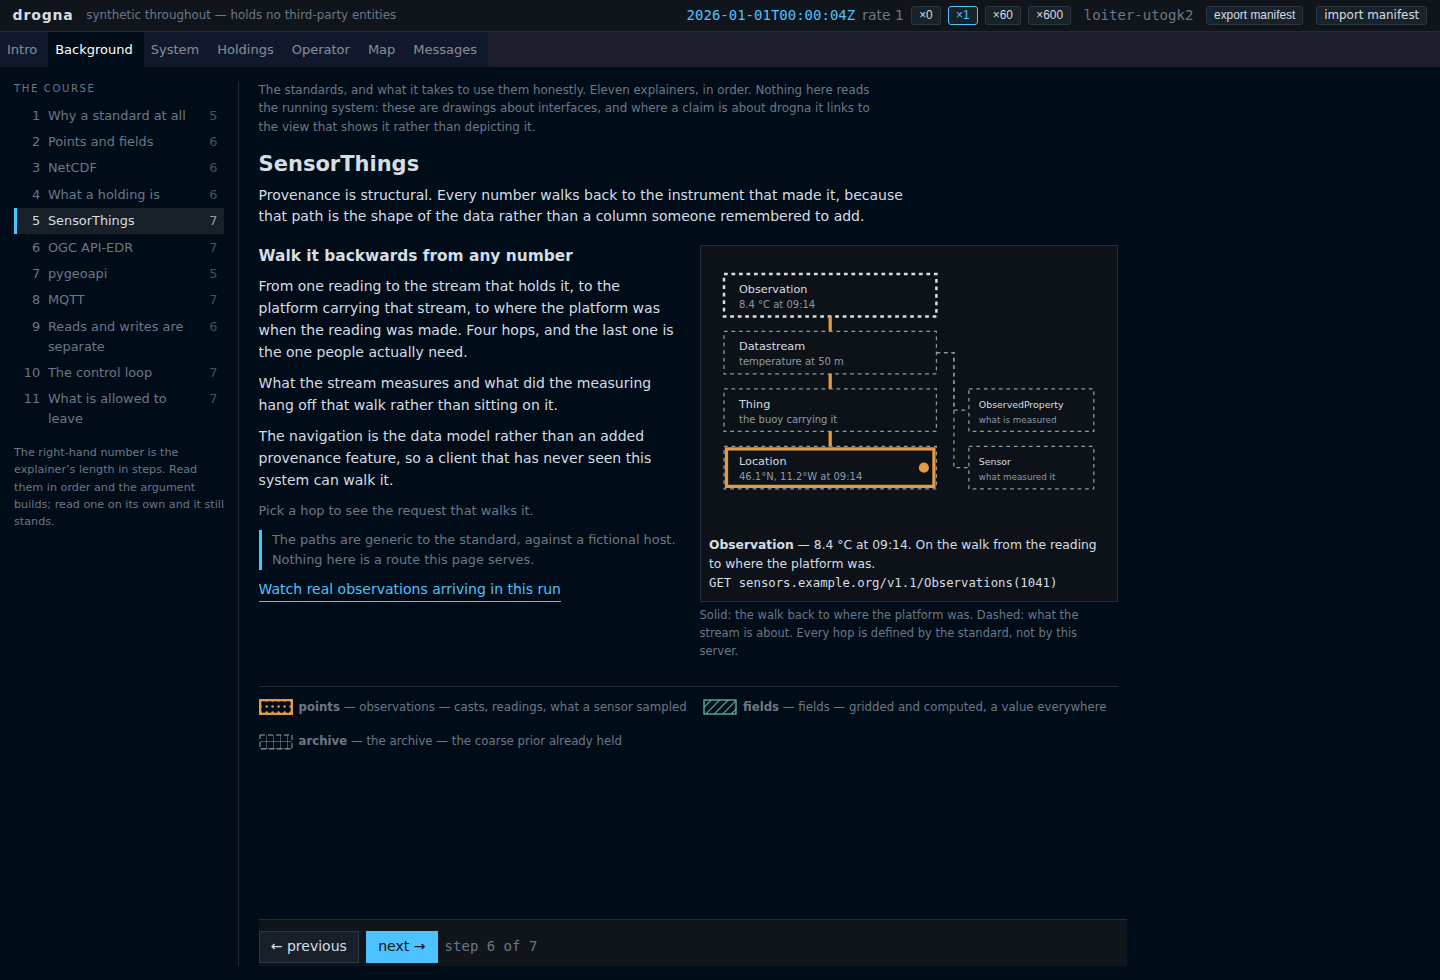
Open it at the SensorThings walk: every step has its own address, and the rail gives each explainer's length.