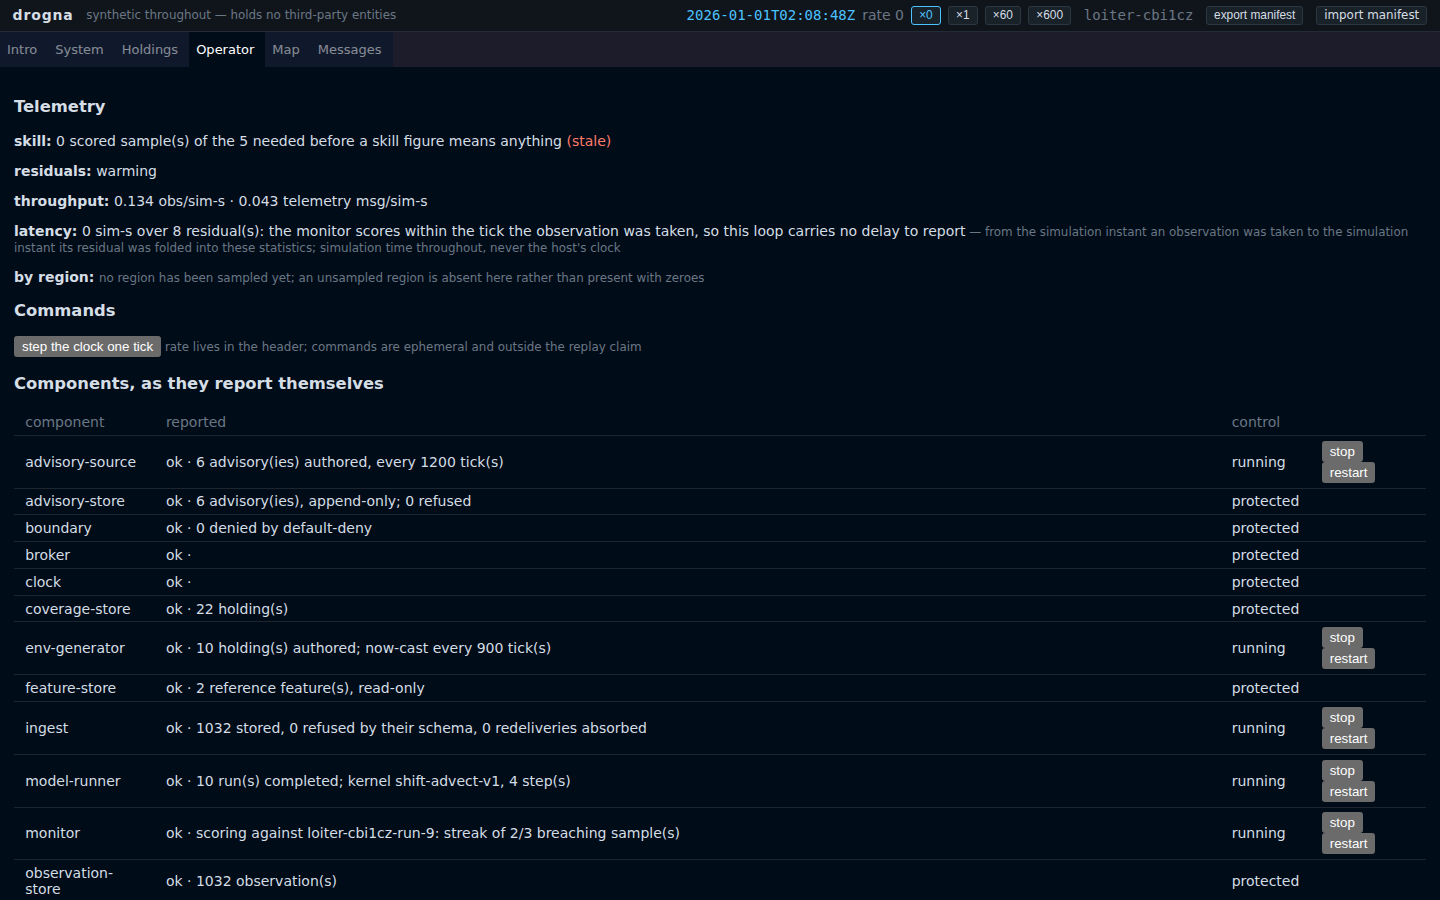
A figure that is always zero
The background
Ask how current an operations picture is and part of the answer is plumbing: time passes between a measurement being taken and anything downstream folding it into a number a person reads. The obvious build subtracts two timestamps, which in a simulation whose clock can run at ×600 measures the dial. Underneath that is the trap: a latency figure from a system where nothing is ever late reads zero — and so does a sign error, or a fold that never happens.
The requirement
Forecast statistics per region rather than for the whole area, since a scenario average hides a region where the model is useless; and how long an observation takes to reach them, in simulation time.
The options considered
The regional grid is laid over the forecast extent the residuals were scored against, which the component already reads, so there is no second copy to disagree with. An unsampled region reports nothing rather than zero: absent and averaging zero are different facts, only one a measurement.
The latency figure took the wrong turning. It read zero, and its test asserted the figure was a number, not negative, with samples folded in: all true, all passing, all worthless. Planted upside down it passed; with the fold instant read from anything but the clock it passed. What fixed it was making something genuinely late — the test dates a published report's samples an hour back in simulation time and requires the figure to move by exactly that hour. The zero itself is true: the monitor scores within the tick the observation was taken, and the surface says so in words.
The demo
Open it at the Operator tab and let it run: the table fills as the platform samples.