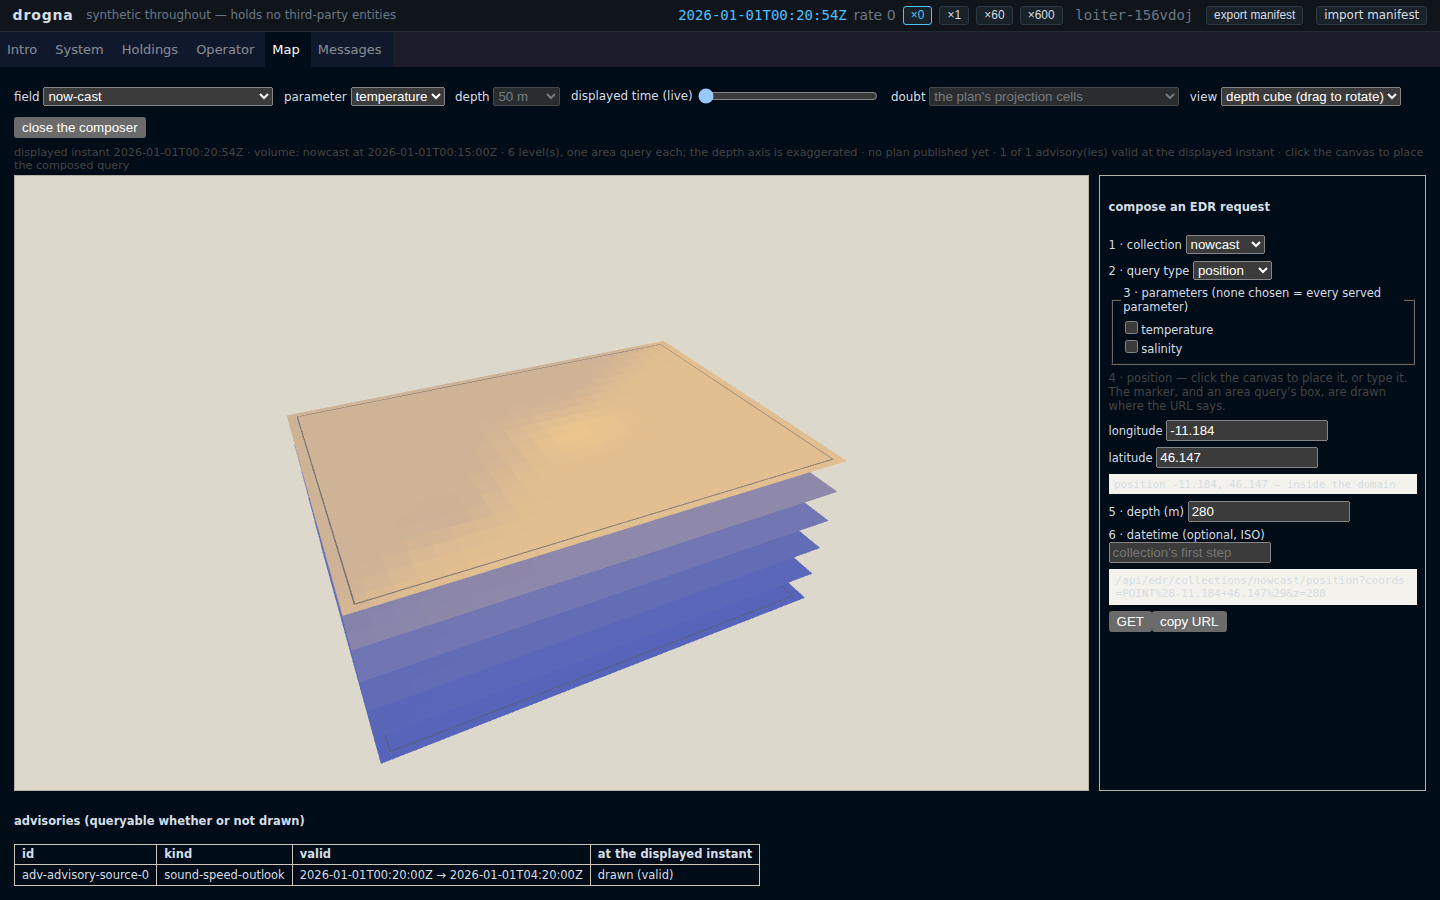
The map you can point at
The background
A gridded service answers "what is the temperature here, at this depth, at this time". How a person gets the coordinate is never settled: they read it off a map, retype it, and get a digit wrong. Once retyped, nothing on screen is bound to the request that went out: picture and query are two claims about one place, free to drift apart.
The requirement
Place a query by clicking the map; show the volume rather than one slice at a time; and make what the canvas draws the same thing the request asks for, by construction.
The options considered
The click is easy. The composer had been holding its own state, so a click and a typed number would have been two copies of one position with a synchroniser between them to go wrong; the state moved up to the map. The cube stacks one area query per level.
The binding is the part worth copying: one function produces the ring an area query covers, the canvas draws it, the request is built from it, and a test holds them equal coordinate for coordinate.
Then a bug the tests missed and the page found. The map shades uncertainty from a forecast's spread, which covers its run's horizon rather than the field's; the first version asked about the field's instant. The server refused, naming the extent it does cover, and the map printed the refusal — caught in a minute. The test that should have caught it passed because the time steps agreed that tick; now it runs on until they disagree.
The demo
Open it at the map, switch to the depth cube and click a slice: position and depth land in the form, the marker where the URL says.